Content
- What is Google Analytics?
- Key Metrics to Track in GA
- Types of Reports in Google Analytics
- Conclusion
Share This
Equinet Academy
Google Analytics (GA) is a free analytics tool from Google that gives you an in-depth look at your website’s performance. This includes site traffic, backlinks, position tracking, page speed and more factors you need to know to improve your website.
As the latest version of Google Analytics, GA4 has a slightly different user interface (UI) from the soon-to-be-retired Universal Analytics (UA). It integrates Google marketing and advertising platforms with products, including Google Ads, Search Console, and Data Studio.
The reports, tools, and features have also been upgraded.
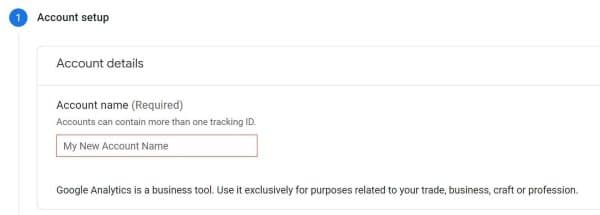
Step 1: Create a Google Analytics account.
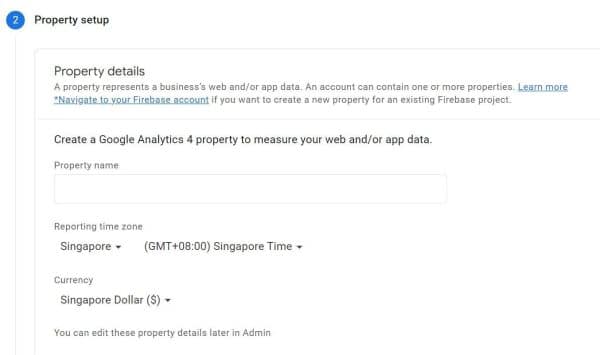
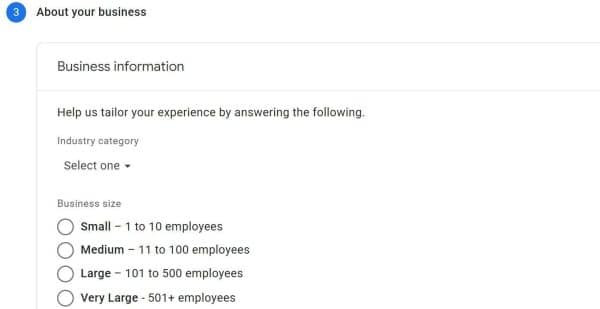
Step 2: Add the name, URL, and industry of your website or website you want to track.
Step 3: Add a Data Stream to your property.
Data streams are where all the valuable information for your website will come from.
There are 3 types of data stream: Web (for websites), iOS (for iOS applications), and Android (for Android applications).
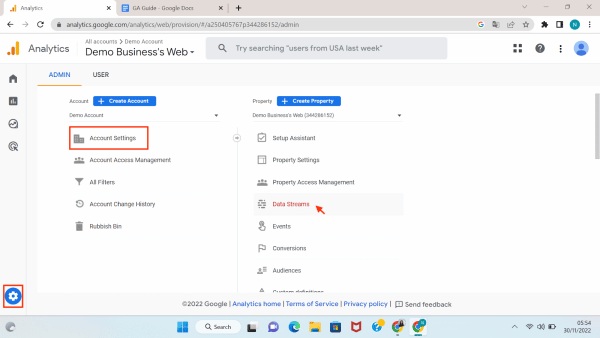
Click on the ‘Settings’ button on the bottom left corner, click on ‘Account Settings’ and select ‘Data Streams’
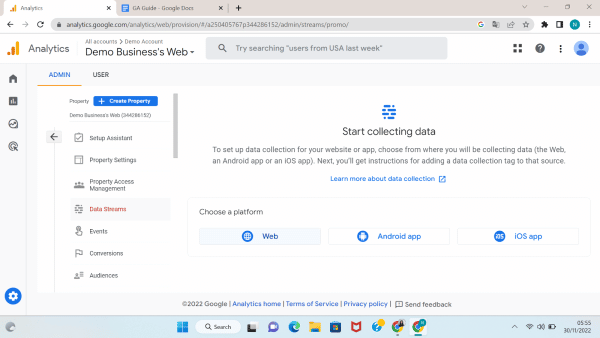
Choose the platform where you will be collecting data (the Web, an Android app or an iOS app)
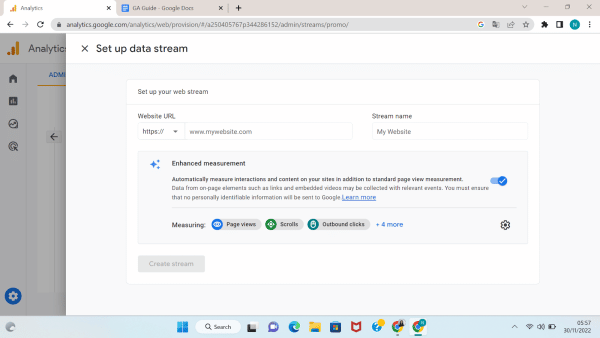
Enter your data information and Stream name
Note: You can opt in or out of the Enhanced measurement by toggling the blue toggle. Enhanced measurement lets you measure interactions with your content by enabling options (events) in the Google Analytics interface. When you enable these options for a web data stream, your Google Analytics tag starts sending events right away.
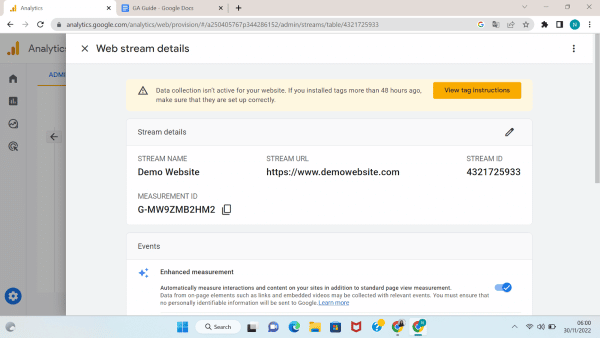
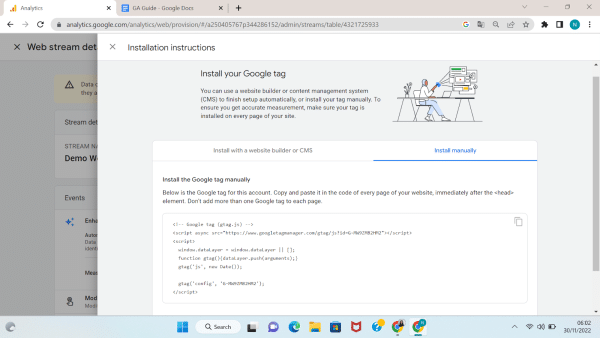
Step 4: Add your tracking code directly after the tag of your site.
You will get this unique code after filling in the Data Stream.
The latest Google Analytics version (GA4) provides insight into who visits your website and what they do while they are there.
Marketers use GA4 insights to understand the effects of marketing campaigns and how a website’s user experience (UX) impacts factors such as conversion and retention.
The hundreds of metrics and dimensions available in GA4 may seem daunting.
Before we look at the key metrics, you should become familiar with some critical terms and their differences in GA:
Here are the 8 essential metrics you need to know as a beginner to make a calculated decision for your business and website:
Here are the 5 common dimensions you need to know as a beginner to make a calculated decision for your business and website:
Example Engagement Rate = 85% then Bounce Rate will be 100% – 85% = 15%.
From GA4, you can get a variety of reports that will help you in your business.
Your website data is at your fingertips, and insights from Google will help you make improvements for a better website or application.
These are the types of reports you can get from GA4.
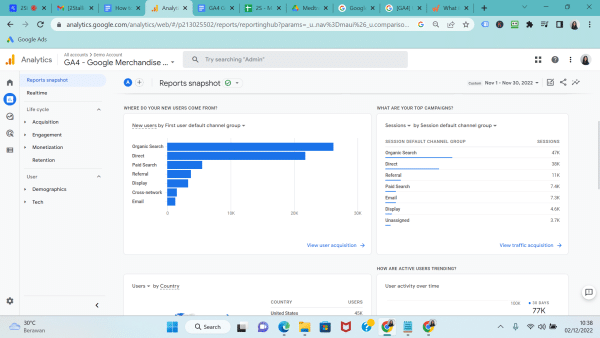
Reports Snapshot is the overview report displayed when you click Reports in the side menu navigation. It shows the overview of all the reports within your Google Analytics.
The reports snapshot can be used for analysing Google Analytics in an easier and more time-effective way.
You can check summary reports or statistics during a specific period; monthly, weekly or custom dates. Through this, you can check the marketing performance of your website.
Is your website generating revenue, getting new users, and retaining users? This section provides you with data insights.
It also gives an overview of user behaviour such as pages with most traffic, top-selling products and other actions taken on your website.
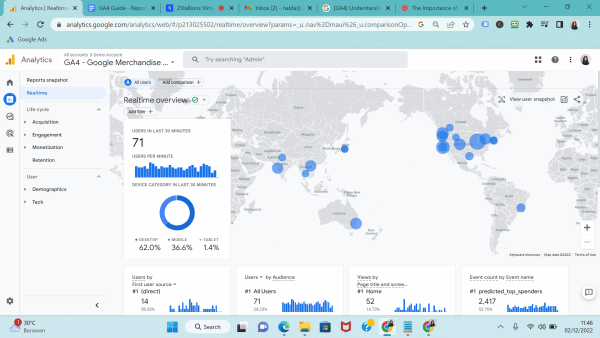
The Realtime Report lets you monitor activity on your website or app as it happens. This report lets you see users’ interactions on your site or app during the last 30 minutes.
The real-time report can be used for:
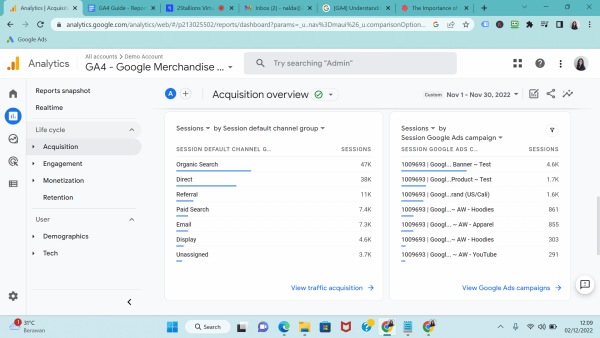
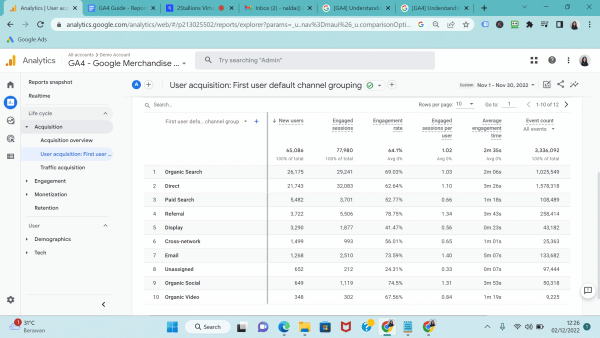
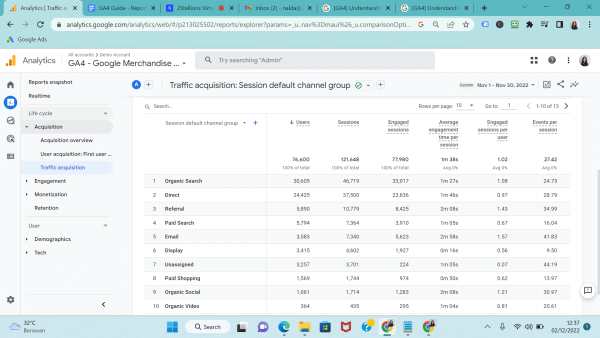
Acquisition provides information on the origin of your web traffic (e.g., Google, Baidu, Bing), the methods by which users arrive at your site or app (e.g., organic, CPC, email), and the marketing efforts you use to drive traffic (e.g., campaign, creative format, keywords.
GA4 provides the following Acquisition reports by default:
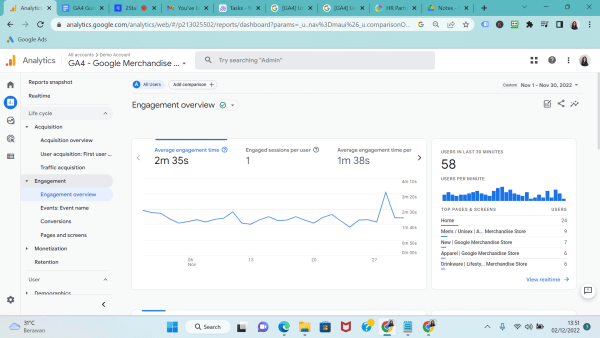
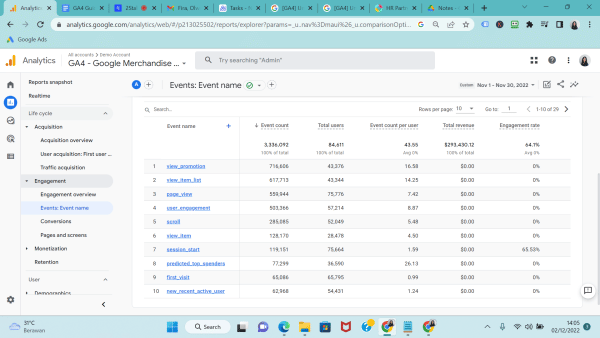
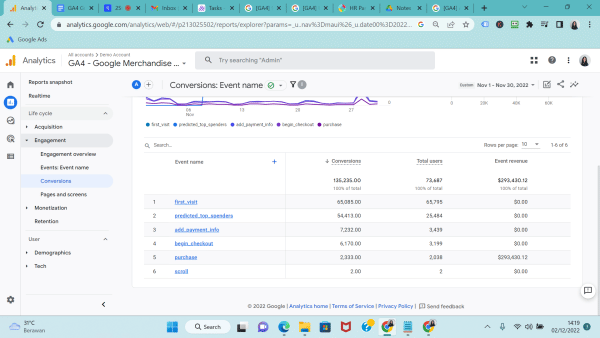
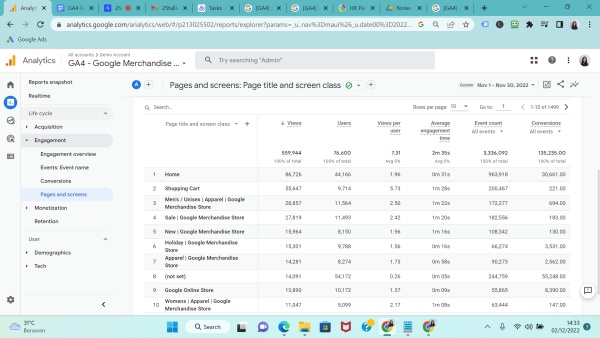
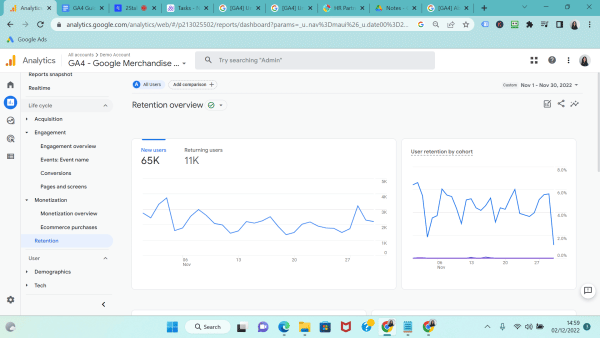
Engagement lets you measure user engagement by the events and conversion events that users trigger and the web pages and app screens that users visit
GA4 provides the following Engagement reports by default:
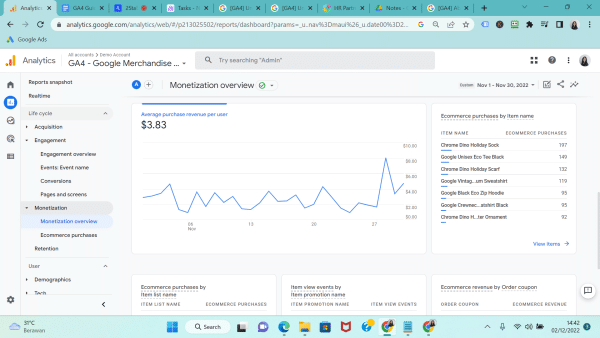
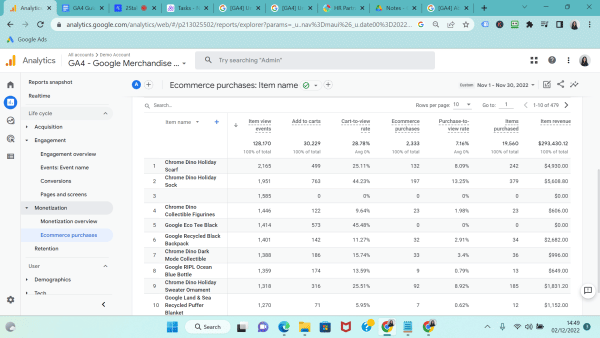
Monetisation enables you to see the revenue you generate from the items, ads, and subscriptions on your website or app
GA4 provides the following Monetisation reports by default:
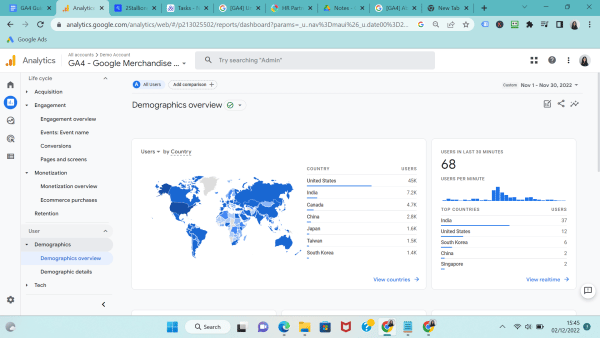
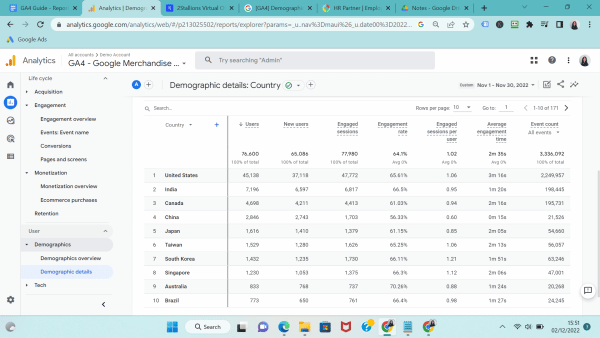
Demographics help you classify your users by age, location, language, and gender, along with the interests they express through their online browsing and purchase activities
GA4 provides the following Demographic reports by default:
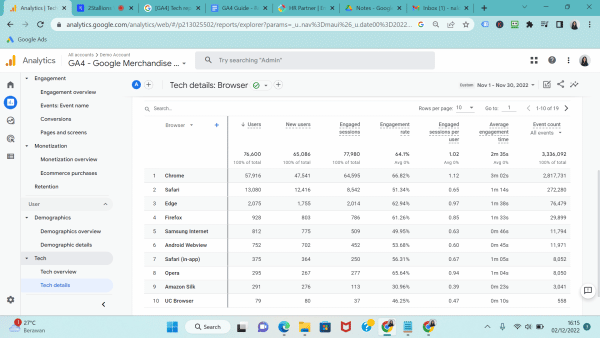
Tech shows traffic based on the technology your audience uses. GA4 provides the following Tech reports by default:
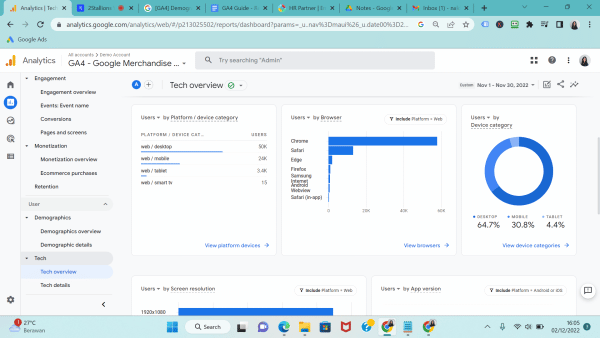
Picture 15 – Tech overview report
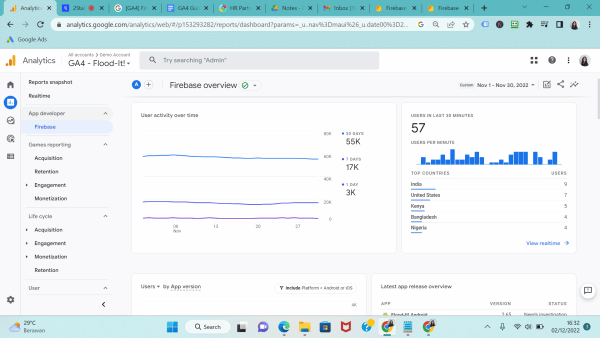
GA4 adds an app developer collection when you connect your mobile app with your property.
When you want to analyse your app data in GA4, you can connect GA4 to Firebase. Firebase is an app development platform that helps you build and grow apps and games users love.
User interaction is also displayed in this report for example which page screens are being viewed, what events are being triggered, and what events drive the conversions.
This article only scratches the surface of the incredibly powerful Google Analytics 4 platform.
If you want to learn about the ins and outs of GA4, consider signing up for our Digital Marketing Analytics Course. Our expert trainer will go through everything you need to know to effectively track, measure, and optimise your website’s performance in two days.
We also offer a Certified Digital Marketing Strategist (CDMS) Programme, which covers the following six modules:
Learners who complete these modules will be awarded a Certified Digital Marketing Strategist certificate. The courses are all WSQ accredited and are available for up to 70% subsidy.
Article Written By
Dhawal is the Managing Director at 2Stallions Digital Marketing Agency, an award-winning full-service digital marketing agency, based out of Singapore that he co-founded in 2012. It has grown from a founding team of 2 to a team of 20, and growing, across 4 countries. He has overseen more than 250 successful digital marketing projects with clients ranging from startups to MNCs.
Receive the latest blog articles right into your inbox.
Reader Interactions