Common Metrics used to Focus for Your Business
Before we delve deeper into the common metrics of digital marketing, it will be more beneficial for us to separate the metrics into the 2 categories of User Journey & Digital Channels and Platforms for the ease of understanding.
User Journey
The user journey refers to the process a user goes through with your brand; from browsing to purchase and post-purchase. To be able to identify the stage a customer is at in the journey will help to create personalised experiences. We can further sub-divide it into 3 parts of Media Channel, Website and Action.
Media Channel Metrics (Before a user lands on a website or mobile app)
All marketers want to grow their brands and bring new customers to their websites. To achieve that, brands need to make an impact on new users. Investing in paid ads is one method of increasing the business’ visibility.
Metrics associated with the media channels primarily focus on the viewing and engagement aspects of the advertisement or content that appeals to users.
For example, upon browsing content on websites like Today Online or social media platforms like Facebook, a user finds interesting content and decides to click on it. The metrics that measure this engagement will fall under media channel metrics.
Outlined below are some of the more common metrics and their definitions.
- Reach: This metric is used widely on social media platforms like Facebook or Instagram. It refers to the total number of people exposed to a piece of digital content or advertisement over a period of time. If 50 people have seen the advertisement, the ad reach will be 50.
- Impressions: It refers to the number of times the advertisement is shown on a user’s screen. If 200 impressions are shown to 50 people, each person views the digital content or advertisement 4 times. The user does not need to take any action for it to be regarded as an impression.
- Clicks: The number of times users click to perform an action on your content or advertisement, which usually leads to your designated landing page.
- Click-through rate (CTR): A measurement of the percentage of clicks over total impressions on your digital content or advertisement. Formula as shown:
CTR = (Total Measured Clicks / Total Measured Impressions) x 100%
A higher click-through rate represents a higher interest or relevancy to the users. If the campaign has 1,000 impressions and 20 clicks, the CTR is 2%.
- Cost per thousand impressions (CPM): A metric to determine the cost of the digital advertisement per 1,000 impressions. It is a measurement of total ad spends over total ad impressions as shown in the formula:CPM = (Total Ad Spend / Total Measured Ad Impressions) x 100%
This metric is useful for monitoring ad performances. If a website publisher charges $2.00 CPM, an advertiser must pay $2.00 for every 1,000 impressions of its ad. Do note that The “M” in CPM represents the word “mille”, which is Latin for “thousands”
- Cost per click (CPC): The price you pay to the digital ad platforms for each click on your digital content or advertisement of a digital marketing campaign. It’s calculated based on the total money spent on media advertisement over the total clicks. Formula as shown:
CPC = Total Money Spent on Ads / Total Measured Clicks
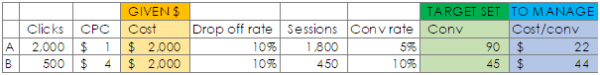
If an advertiser spent $2,000 on Facebook advertisements and has attracted 2,000 clicks, the CPC would be $1. You should aim to have a low CPC as you can allow more clicks for your budget, which would translate to more potential leads.
Differences between CPC and CPM
CPC focuses on the cost for the person clicking on the ad, whereas CPM highlights the number of people who viewed your ad, regardless of whether they clicked on it. Simply put, CPM calculates the impressions and reaching out to people with the advertisements, while CPC is engaging people and getting them to click on your advertisements. What does this translate to?
CPM will be the measurement of choice if you are aiming to improve brand awareness. It helps in making as many impressions as possible with your budget.
In contrast, CPC would be a better metric if your area of focus is on earning conversions and taking action, such as making a purchase or downloading a whitepaper. This is because marketers endeavour to keep the CPC low so that more clicks can be earned resulting in more leads that convert.
CPC is also a dependable metric in measuring conversions based on actions that are meaningful to a business, like when a user downloads a whitepaper or makes a purchase.
Website Metrics (After a user lands on a website)
Once users click on an online advertisement or content that interests them, they will be directed to your website. The metrics that matter to the business would be the traffic and user behaviour on the website. Outlined below are some of the more common metrics and their definitions.
- Users: The number of unique visitors who visit your website. The returning visits of the same visitor are considered as the same user. For example, if someone lands on the website, leaves and returns after 30 minutes, that is still considered 1 user.
- New user: It refers to the users who visit your website for the first time based on the time frame selected. However, avoid being too engrossed in acquiring new visits that you neglect the existing audience base.
- Sessions: This metric can be viewed as the number of visits a website has. A single session can contain multiple pageviews, events, interactions, and transactions. If a user lands on the website, leaves and decides to return after 30 minutes, it counts as 2 sessions. If out of the 50 users, there are 100 sessions, this translates to each user visiting the website twice, and the average session per user is 2.
- Pageviews (PVs): This refers to the number of pages viewed within the website during a stipulated time frame.
- Pageviews per session: A ratio of the number of pages viewed over the number of visits. For example, if there are a total of 1,000 pageviews and there are 500 visits, the pageviews per session is 2. This is an engagement metric to show the level of users’ stickiness.
- Average Session Duration: This refers to the average time a user spends during a session. This metric illustrates how long users stay on your site. This is especially useful for content publishers or websites as it is a key metric to represent users’ interest.
- Bounce rate: This refers to the percentage of single-page visits. When we have a bounce rate of 40%, it means 40% of the users landed on the website and left that page. Bounce rate is useful as a general signal of user engagement and the state of content quality. It helps to identify when problems exist on your site.
Action Metrics (After a user performs a defined action on the website)
When the user lands on a website, the user engages with the website, performing different actions such as submitting a form, making a purchase or downloading an eBook. These are just some of the actions that a website visitor might perform on a website. Outlined below are some of the more common metrics and their definitions.
- Leads: The number of potential customers who have expressed an interest in the products and services of your business, typically generated through interactions with the business.
- Sales transactions: The number of sales completed on the website.
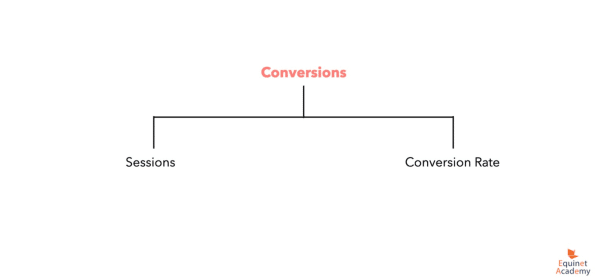
- Conversions: An action defined by the business owner or marketer. A conversion is not solely limited to online purchases and can take many forms. It might include
- Every download of an eBook
- Clicking on the video play button
- Newsletter subscriptions
Essentially, conversions are the return on investment (ROI) for the spending, and it’s crucial to track this to gauge the campaign’s true performance.
- Conversion rate: To calculate the conversion rate, divide the number of conversions (number of people who took the desired action) by the sessions (number of people who saw the message or ad) and multiply by 100%. For example, if a website records 100 sessions and 50 email newsletter subscriptions, the conversion rate is 50%.
- Cost per conversion: The amount you need to spend or have spent for a conversion. It’s calculated based on the total cost of the campaign over the total number of conversions. The formula as shown:
Cost Per Conversion = Total Cost / Total Number of Conversions
If the advertiser spends $2,000 and has achieved 50 conversions, the cost per conversion is $40.
- Goals: A conversion needs to be set as a goal on the Google Analytics platform. If your conversion is a form submission, it will be recorded as a goal when a user completes the form.
- Average order value (AOV): AOV tracks the average amount of sales each time a customer places an order or makes a purchase on a website. It is calculated based on total revenue over the total number of orders made. The formula as shown:
AOV = Total Revenue / Number of orders
For example, if a company recorded a revenue of $5,000 based on 50 sales transactions or orders, the AOV would be $100.
Metrics Across Various Digital Channels and Platforms
As discussed earlier, you can view metrics through the lens of a user’s journey. You can also associate metrics with the various digital channels and platforms.
Certain metrics are more relevant to specific channels, whereas some can be used more universally. Metrics like clicks or traffic can be used in any context.
However, metrics like open rates and unsubscribe rates are more relevant to channels like email marketing. In contrast, metrics that are associated with organic search (Google) might likewise include domain authority and keyword rankings.
Specific platforms, such as Facebook, will use reach and cost per result, which can be found on the Facebook Ad Manager tool.

Reader Interactions