Equinet Academy


Download (Link Opens in New Tab)
Companies nowadays place great emphasis on Key Performance Indicators (KPI) to monitor the health of their businesses. KPI’s showcases data to determine whether the business has grown or shrunk and offer snapshots to the management to take any remedial action.
This is also true in Social Media KPIs where we need definite data to ascertain the effectiveness of the campaigns and not just solely having the highest number of likes and determining that to be successful. For your benefit, we have compiled a comprehensive list of social media metrics with a brief explanation of each for your next project. Let’s delve deeper into the various metrics.
Click on any section to go to those metrics directly :
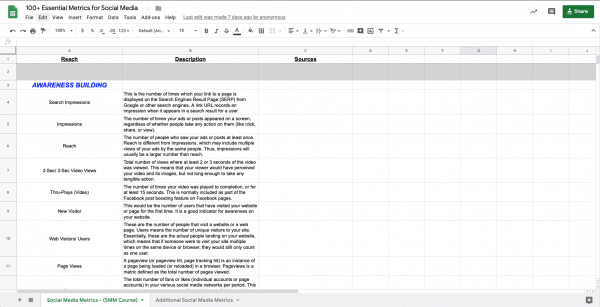
Social Media Metrics
Awareness Building
Awareness metrics is an important element in your bag of KPI’s as it illustrates on the level of awareness of your current and potential audience on your business. With the comprehension of the data, you can make better decisions on whether the customers will progress towards the evaluation stage and finally the purchase stage.
2-Sec/ 3-Sec Video Views
Total number of views where at least 2 or 3 seconds of the video was viewed. This means that your viewer would have perceived your video and its images, but not long enough to take any tangible action.
Ad Frequency
Ad frequency measures the number of times your target audience viewed the ad. Keep an eye on ad frequency to ensure that the same people don’t see the same digital ad continuously, as this can cause banner blindness and lead them to ignore the ad altogether. Overly frequent ads may also cause viewers to report or block your ad, and this will lead to a decrease in your ad quality or relevance score.
Awareness Lift (YouTube)
The aggregate increase in user familiarity with your brand, product, or service when compared to a randomised control group of users who did not see your ad.
Brand Mentions
This measure is unique in that it provides an insight into how many times your brand is mentioned online, which includes sources like social media, 3rd party websites, and blogs. This can be either your brand name itself, or the hashtag which you use for a specific campaign, or your company name, or even your personal brand name/ CEO’s name. To track brand mentions, you can use tools like Google Alerts, Mention, or Social Mention, or Talkwalker.
Cost Per Estimated Ad Recall Lift
Estimated ad recall lift (people) rate is the estimated incremental number of people who recall your ad divided by the number of people your ad reached. Cost per estimated ad recall lift (people) is the average cost per incremental person we estimate will recall seeing your ad if asked.
Cost per estimated ad recall lift (people)
The average cost for each estimated ad recall lift. This metric is only available for advertisements that you run using the Facebook Campaign Brand Awareness Objective. It provides an estimate of the proportion of people who can recall your brand.
Cost Per Thousand Impressions (CPM)
Cost per thousand, also called cost per mille, is used to denote the price of 1,000 paid impressions on a media channel. If the cost of your ad is $2.00 CPM, that means that you as an advertiser must pay $2.00 for every 1,000 impressions of your ad. The CPM is usually determined by a combination of your ad quality metrics, competitive bidding (hence festive occasions normally have higher CPM costs), and your page quality metrics.
Cost Per Thousand Reach (CPR)
The metric is calculated as the total amount spent divided by the reach, multiplied by 1,000. It measures people reached across the different social media platforms. In the case of Facebook ads, they may include Facebook Newsfeeds, Stories, Instagram, Messenger and the Audience Network.
Cost Per Thru-Play
The average cost for each ThruPlay. The metric is calculated as total amount spent, divided by ThruPlays.
Cost Per Video View
The average cost per video view, calculated as the amount spent divided by the number of video views.
Estimated ad recall lift (people)
An estimate of the number of additional people who may remember seeing your ads, if asked, within 2 days. This metric is only available for Facebook ads that use the Brand Awareness Campaign Objective.
Estimated ad recall lift rate (%)
The rate at which an estimated percentage of additional people, when asked, would remember seeing your ads within 2 days. This metric is only available for advertisements in the Facebook Campaign Brand Awareness Objective.
Impressions
The number of times your ads or posts appeared on a screen, regardless of whether people take any action on them (like click, share, or view).
New Visitor
This would be the number of users that have visited your website or page for the first time. It is a good indicator for awareness on your website.
No of Fans/ Likes
The total number of fans or likes (individual accounts or page accounts) in your various social media networks per period. This is normally a good measure of Top Of Funnel (TOFU) visibility as pages with more fans tend to get a higher reach per post shared.
No of Followers
The total number of people (or accounts) that are following you on your social media account or page per time period. Often followers are also fans, but they may also be competitors who do not wish to be targeted with ads!
Page Views
A pageview (or pageview hit, page tracking hit) is an instance of a page being loaded (or reloaded) in a browser. Pageviews is a metric defined as the total number of pages viewed.
Reach
The number of people who saw your ads or posts at least once. Reach is different from impressions, which may include multiple views of your ads by the same people. Thus, impressions will usually be a larger number than reach.
Search Impressions
This is the number of times which your link to a page is displayed on the Search Engines Result Page (SERP) from Google or other search engines. A link URL records an impression when it appears in a search result for a user.
Share Of Voice (SOV)
Your Brand Advertising / Total Market Advertising = Share of Voice. Calculating share of voice on social media involves collecting the voice of the customer through a social media analytics tool, such as Brandwatch Analytics.
Thru-Plays (Video)
The number of times your video was played to completion, or for at least 15 seconds. This is normally included as part of the Facebook post boosting feature on Facebook pages.
Unique Users (YouTube)
The number of distinct individuals who have been served your video, irrespective of number of views.
Web Visitors/ Users
These are the number of people that visit a website or a web page. Users means the number of unique visitors to your site. Essentially, these are the actual people landing on your website, which means that if someone were to visit your site multiple times on the same device or browser, they would still only count as one user.
Consideration Engagement
The list of metrics below shows how people are interacting with your content. This data is important as businesses know the higher the engagement, the greater the likelihood it would be converted into a sale.
30-second video views
The number of times your video was watched for an aggregate of at least 30 seconds, or for nearly its total length, whichever happened first. Video views are normally counted separately from impressions, and any time spent replaying the video is excluded.
Actions
These are the different types of actions that a user may take on your social media account, eg click on an email button, or send a message, fill in a lead form, or others.
Applause rate
The number of approval actions, or virtual “applause,” you get from your audience per period, including +1s, likes, thumbs-ups, favorites, etc.
Average Engagement Per Post
This is the average number of interactions that you’ve managed to achieve for each post on your social media account. This is normally recorded over a specific time period.
Average engagement rate
The percentage of your total audience that has engaged with your content in any way on a social channel per reporting period.
Blog Page Views
The number of views on your blog page on your website. This is normally measured by the number of page views for that article.
Bounce Rate
The percentage of visitors who only went to a single page of your site, bouncing back to the place they came from rather than clicking further into the site. Generally, a lower Bounce Rate is preferred as it is equated to greater stickiness of your website and its content.
Click Through Rate (CTR)
The Click Through Rate (CTR) is derived by the number of Clicks on your link or post or ad, divided by the number of Impressions that it is being served (ie number of times it is shown). This is a good indicator of the efficiency of your ad/post in eliciting a click action.
Comment rate
The average number of comments your content gets per post.
Comments
The post comments metric counts all comments that people made on your posts or ads while they were running. In general, longer comments have better value than short ones. The best practice from an engagement point of view is to trigger as much conversation as possible on your posts – however, you may not want to do that if your goal is to derive link clicks (ie traffic) to a landing page.
Cost Per Action (CPA)
This is the average cost for ads to trigger the number of actions that you have established. The CPA may vary depending on the types of actions being recorded.
Cost Per Click (CPC)/ Cost Per Link Click
The average cost for each link click. CPC shows how much, on average, each link click costs you. CPC is a metric used in the online advertising industry for benchmarking ad efficiency and performance. The metric is calculated as the total amount spent divided by link clicks.
Cost Per Landing Page View
The average cost for each landing page view. This metric is calculated as total amount spent divided by landing page views. This metric is normally used by Facebook Ads.
Cost Per Page Like
The average cost for each Facebook Page like. This metric is calculated as total amount spent divided by new Page likes acquired through the Engagement campaign on Facebook Ads.
Cost Per Post Engagement (CPE)
The average cost for each post engagement. This metric is calculated as total amount spent divided by post engagements/ interactions.
Cost Per X% Video View
The average cost per X% video view, calculated as the amount spent divided by the number of times your video is watched by X%.
Cost Per X-second Video View
The average cost per X-second video view, calculated as the amount spent divided by the number of X-second video views.
Engagement/ Interactions
Engagements or Interactions shows you all the different types of actions that users may take on your posts or tweets. This typically includes the following: – Likes/ Reactions/ Favourites – Saves – Swipes (for Stories) – Comments or Replies – Shares, Reshares, or Retweets – Clicks (either on the image, video or link or other points on the post)
Engagement as a percentage of audience
Total engagement actions across all social networks divided by total audience
Engagement Per Follower/ Fan
Total engagement actions for one network divided by the number of fans (or followers) for that network. This is normally recorded over a specific time period.
Engagement Rate
Typically, the Engagement Rate is measured by the number of engagements/ interactions divided by either the reach of the post or the impressions delivered by the post. This varies depending on the social network that you choose.
Favourites/ ❤s
Also known as favourites or ‘hearts’, this is similar to the ‘like’ metric used in Facebook and LinkedIn. Favourites are commonly deployed on Twitter and Instagram as well as other social networks.
Forward Swipes
The number of times someone swiped to skip to the next account’s story. This is commonly used as a metric on Instagram or Facebook Stories.
Landing Page Views
The number of times a person clicked on an ad link and then successfully loaded the destination webpage. To be able to optimise your ads for landing page views, you must have created a Facebook pixel that is embedded on your website so that Facebook can measure it.
Likes/ Reactions
The number of reactions on your posts or ads or tweets. The reactions button on an ad allows people to share different reactions to its content, eg for Facebook it includes like, love, haha, wow, sad or angry.
Link Clicks
The number of clicks on links within the post/ad that led to destinations or experiences, on or off the social network. For ads promoting Instagram profile views, link clicks include clicks on the ad header or comments that led to the advertiser’s profile. In most cases, link clicks help to drive traffic to a website.
Pages/ Session
In Google Analytics, “Pages / Session” is calculated by dividing the total number of pageviews by the total number of sessions. You can find the data for pages per session by navigating to “Audience” > “Overview.” This is a good indicator for the stickiness of your website in encouraging click throughs internally within your web pages.
Quality Score (Google)
Quality Score is an estimate of the quality of your ads, keywords, and landing pages. Higher quality ads can lead to lower prices and better ad positions.
Referral Traffic
The Referral Traffic metric allows your team to monitor how much of their traffic is through referrals, and where the bulk of these referrals are coming from. This metric shows you the effectiveness of your external links bringing traffic to your website.
Replies
The number of times a viewer swipes up and responds to a story. The reply feature starts a direct message conversation between you and the viewer.
Returning Visitor
The Returning Visitor Metric tracks what happens when someone returns to your website multiple times. This metric allows digital marketers to see how effective they are at building and retaining an audience online. This is particularly important to demonstrate the value of ongoing content marketing efforts.
Retweets
The Twitter retweets metric represents the total number of times a Twitter post is retweeted. The Twitter retweets metric is a total of all the times a Twitter post was retweeted.
Saves
The total number of times your post has been saved. Post Saves counts the number of times your oost was saved by people who want to revisit it at a later time. This metric lets you measure your saves and compare them to saves from other posts or ads and campaigns. People can save posts/ ads by choosing the Save option on the dropdown menu, or by tapping/clicking the Save button on an ad.
Search Clicks
Any click on the SERP that sends the user to a page outside of Google Search is counted as a click, and clicking a link that stays inside search results is not counted as a click. In the SERP, the more people click on your link, the better your ranking would be relative to other pages that are listed on the same page.
Session Duration
Total duration of all sessions (in seconds), which is a good indicator for how good your website is in encouraging a longer stay before a user clicks out.
Shares
The number of times a user shares your post on their own accounts. This will show in their timelines as well, and is a good measure of both engagement and virality.
Taps Backwards
The number of times a viewer tapped the left side of the screen to rewatch the previous story.
Upward Swipes
The number of times a user has swiped upwards on Instagram to visit a website or a YouTube video or other resource outside of Instagram. To get this capability, you need at least 10,000 followers on your IG account.
Video watches at 25%
The number of times your video was watched at 25% of its length, including watches that skipped to this point.
Video watches at 50%
The number of times your video was watched at 50% of its length, including watches that skipped to this point.
Video watches at 75%
The number of times your video was watched at 75% of its length, including watches that skipped to this point.
Video watches at 95%
The number of times your video was watched at 95% of its length, including watches that skipped to this point.
Video watches at 100%
The number of times your video was watched at 100% of its length, including watches that skipped to this point.
Watch Time
Measures the total amount of time people watched your videos on YouTube or other social networks, shown in seconds and minutes. On YouTube, Watch Time is the most important indicator determining the quality of your engagement – a longer watch time will make your video rank better on Search and be more frequently recommended.
Conversion Metrics
This is the most important social media metric, as it measures the effectiveness of social media engagement. This metric measures the progress a potential customer makes towards becoming a paying customer in an important way.
App installs
The number of app installs that were recorded as app events and attributed to your ads. If your app is connected to Facebook (through the Facebook SDK or other connection), this metric counts when the app event is reported, attributed to your ads.
Average order size
“Average order value (AOV) tracks the average dollar amount spent each time a customer places an order on a website or mobile app. To calculate your company’s average order value, simply divide total revenue by the number of orders.
How to calculate sales conversion rate:
Revenue / Number of Orders”
Average purchase value/average order value
The average value of each purchase made by your customers.
Average revenue per customer
How much the average customer spends with a brand, found by dividing yearly revenue by yearly customer count
Calls
The number of calls that you’ve achieved through your social media campaign. These calls can be tracked either manually or by a link that is connected to a software that is a call tracker.
Check-ins
The number of check-ins to your Facebook Page that are attributed to your ads. If your Page has a physical address associated with it, people can check in to your Page when they update their status in their Facebook News Feed or Timeline.
Conversion Rate (CR)
The percentage of users who take a desired conversion action, found by dividing number of conversions by total traffic (or clicks) per period. The Conversion Rate is one of the most important indicators in social media marketing and can determine the success or failure of your campaign for conversion focused campaigns.
Conversion Rate Ranking
Ad’s expected conversion rate compared with ads that had the same optimisation goal and competed for the same audience.
Conversions
Number of conversions per time period (Conversions can be defined as the ultimate action you’d like users to take on your site. Examples might be: email subscriptions, downloads, registrations, installations widget or tool, etc)
Cost Per App Install
The average cost for each app install. The metric is calculated as total amount spent divided by app installs.
Cost Per Call
“The Cost per Call metric gives your team insight into just how effectively resources are allocated for call management in terms of how much it costs to handle a call.
Formula:
Total cost of all calls/Total number of calls”
Cost per conversion
Dollar amount of how much a brand pays in order to attain a conversion
Cost Per Customer Acquisition
Customer acquisition cost (CAC) is a metric that calculates the cost to acquire a new customer. It can be calculated by simply dividing all the costs spent on acquiring more customers (marketing expenses) by the number of customers acquired in the period the money was spent. For example, if a company spent $100 on marketing in a year and acquired 100 customers in the same year, their CAC is $1.00.
Cost Per Event Response
The average cost for each event response. The metric is calculated as total amount spent divided by event responses.
Cost Per Lead
The average cost of each lead. This metric is calculated as total amount spent divided by leads, and is a good measure of how effective your lead acquisition campaign efforts are.
Cost Per Messaging Conversation
The average cost for each messaging conversation started. This metric is calculated as the total amount spent divided by the number of messaging conversations started.
Cost Per Sale
“The cost per sale (CPS), also known as the pay per sale, is a metric used by advertising teams to determine the amount of money paid for every sale generated by a specific advertisement. Understanding and tracking the CPS allows advertisers to take steps to reduce their costs, thus increasing profit and optimizing productivity.
The CPS can be calculated by dividing the total amount of money the company spent on the ad campaign (the cost) by the sum of all sales made.”
Customer Acquisition
Customer acquisition refers to the number of new profiles, or customers, that have been added to your customer base. As the goal of many businesses is to increase their customer size, this metric is extremely telling as to how well the business is meeting its growth goals.
Downloads
This is the number of people who have downloaded a resource (usually an eBook or guide or checklist) as a result of a campaign on social media that you’ve run.
Email Clicks
Email “Clicks” or “Click-throughs” are shown in your reports when people are clicking on your links in your message content. They allow you to see how many people clicked on a link, and who those people are, to help you figure out how much traffic is being driven to the sites you are linking to. Tracking links are set up automatically when a message is saved so that all of the links in your content can be tracked. These links will show up in your email reports with the number of clicks and which recipient clicked them.
Email Open Rate
Email open rate is the percentage of the total number of subscribers who opened an email campaign.
Email Sales
This tracks how many sales have been achieved through your emails that are sent out to a database, and it can either be online (directly tracked through a conversion goal on Google Analytics or Facebook Ads) or offline.
Event Responses/ Sign Ups
The number of people who responded Interested or Going to your Facebook event, attributed to your Facebook ads.
Leads
The number of potential sales contacts earned through social media per time period. These leads could normally come from event participants, people who filled in a form to download a resource or to register for a free mini-course, or other sources.
Messages
The number of messages that you obtained through Facebook Messenger, or other social media direct messaging (eg Twitter, Instagram or LinkedIn) as a result of your campaign.
New visitor conversions
Number of conversions that occurred per time period by visitors new to a brand’s website
Offer Claims
The number of claims on your offers as a result of your Facebook post and Facebook Ad.
Participants/ Attendees
The total number of participants or attendees to an activity or event that you’ve garnered through your social media campaign.
Profit
Profit is measured by the Revenue minus the Costs of a campaign. This is the gross profit for each campaign.
Return On Ad Spend (ROAS)
How much money your ad earned compared to the total amount paid, based on data from your pixel, app or offline event set. Return on ad spend shows if your ad is profitable. The higher this number, the greater your return. Your ROAS goal will depend on your profit margins. Return on ad spend is calculated as your conversion value (normally your profit) divided by your cost.
Return visitor conversions
Number of conversions that occurred per time period by visitors returning to a brand’s website
Revenue
Revenue is the lifeblood of all businesses. It’s the total amount of money your business brings in. Your gross revenue is everything before expenses. To track revenue, you can set-up ecommerce tracking in Google Analytics or on Conversion Ads on Facebook Ad Manager.
ROI or return on investment
Revenue generated by social media efforts divided by all known social media expenses
RPC (revenue per click)
The average amount of revenue generated per click in paid advertising
Sales (qty)
This is the numbers of sales transactions which you’ve made through your social media marketing campaign, based on the total quantities sold over a specified time period. These can be tracked either online (through a conversion tag like Facebook Pixel or Google Tag Manager) or offline (manually).
Sales (revenue)
This is the total value of the sales that are made through the social media marketing campaign, based on a specific time period.
Sales conversion rate
“The Sales Conversion Rate metric measures the effectiveness of your sales team at converting leads into new customers. It’s an important metric for aligning your sales and marketing team as both teams will use this metric to determine the quality of leads.
How to calculate sales conversion rate
(Leads converted into sales / qualified leads) x 100
(Number of conversions / Number of Clicks) x 100”
Loyalty /Advocacy Metrics
These metrics will assess how happy your customers are and go on to be your brand’s spokesperson. This is a key component to a successful marketing campaign.
3rd Party Blog Posts
This is an indication of how many influencers/ media owners have written about your product or service or company. It is normally used when a dedicated influencer marketing or PR campaign is deployed.
Account/ Hashtag mentions
Organic mentions, like @mentions that aren’t part of a reply, or tagging a brand in an Instagram story without prompting, indicate good brand awareness.
Amplification rate
“The number of shares on average for each post. Depending on which networks you’re active on, you might want to amplification rate apart, focusing on:
• Twitter retweets
• Facebook shares
• LinkedIn shares
• Pinterest repins
• Instagram regrams”
Average Engagement Per Fan/ Follower
This shows you the average amount of interactions that you’ve achieved divided by the number of fans/ followers that you have. It is a good indicator of how loyal your fanbase is.
Company/ Brand Followers/following ratio
This is an indication of the star power of your brand and how effective it is in attracting followers or fans relative to the number of accounts that your brand is following.
Compliments / Complaints Ratio
“Records the number of customer compliment received per customer complaints. The metric tells us how ‘very good’ customer experiences are balanced with the ‘very bad’ ones. The metric also provides an insight into the mind-set of our customer base.
To calculate:
Total Number of Complaints ÷ Total Number of Compliments”
Conversation Rate
Conversation Rate is the ratio of comments per post to the number of overall followers you have. It’s another metric coined by Avinash Kaushik—and it’s better than tracking comments without any context. After all, getting an average of 20 comments per post is a lot more impressive if you only have 200 followers.
Cost Per Page Like
The average cost for each Facebook Page like. This metric is calculated as total amount spent divided by Page likes.
Cost Per Post Share/ Reshare
The average cost of each post share. The metric is calculated as total amount spent divided by post shares/ reshares.
Customer Lifetime Value
“Customer Lifetime Value, usually referred as LTV (sometimes as CLTV or CLV) measures the profit your business makes from any given customer. The purpose of the customer lifetime value metric is to assess the financial value of each customer, or from a typical customer in case you’re measuring it generally.
To calculate it, take the revenue you earn from a customer, subtract out the money spent on serving them, and see for how long they stay bringing you this profit before churning.
LTV = ARPA * % Gross Margin / % MRR Churn Rate”
Customer Retention Rate (CRR)
“Simply put, customer retention rate is the percentage of customers you keep relative to the number you had at the start of your period. This does not count new customers. It is the reverse of customer churn.
There are three pieces of information you need to calculate customer retention:
Number of customer at the end of a period (E)
Number of new customers acquired during that period (N)
Number of customers at the start of that period (S)
Customer Retention Rate = ((E-N)/S)*100”
Customer Satisfaction Score (CSAT)
Customer Satisfaction, or CSAT, is a metric that measures how happy people are with your product or service. Usually, the CSAT score is the product of one, straightforward question: How would you describe your overall satisfaction with this product?
Fan/ Follower Growth
This is a metric to show how good your social media account/ page is in attracting and retaining fans. It is measured by the total number of new fans/ followers over a specific time period.
Fan/ Follower Growth Rate
“This is a metric to show how good your social media account/ page is in attracting and retaining fans. It is measured by the percentage increase in the total no of fans/ followers over a specific time period.
Influencer Comments/likes ratio
Comments/likes ratio is measured for the influencer posts that are specifically on your brand or product. It measures the engagement that you’ve managed to garnered through the influencer. Read our article on social media influencers and how to work with them here.
Influencer Engagement
Consider engagement as any interaction between an influencer’s post, such as likes, comments or video views. So in this case it would be the percentage of the audience that interacts with the influencer’s specific posts that relate to your brand.
Influencer Post frequency
How many posts does the influencer you are interested share per week on your specific brand? Normally, these metrics are pre-determined by the campaign specs that you send to an influencer or an influencer marketing agency.
Net Promoter Score
To calculate this one, customers answer the question, How likely is it that you would recommend [your company] to a friend or colleague? using a scale of 0-to-10 points.
Quote Tweets
While a simple retweet merely shares another person’s tweet, a quote tweet lets you share another person’s tweet and add your own comments to it. Quote tweets are often simply referred to as a “Retweet with comment.”
Referral Traffic (Influencer)
The Referral Traffic metric allows your team to monitor how much of their traffic is through referrals, and where the bulk of these referrals are coming from. This metric is calculated by (Traffic coming from other sites/Total traffic)x100
Repeat Visitors/ Users
This shows you the number of repeat visitors that have returned to your website or blog over a specific time period.
Response Rate
“The Response Rate metric helps your team understand how engaged their users are, and if their messaging prompts responses effectively.
Formula
(Customers responding/Customers exposed to communications)x100”
Retweets
A count of how many times the Tweet has been Retweeted (ie shared further on Twitter). Please note: This does not include Quote Tweets (“Retweets with comment”).
Value Per Customer
“Understanding customer value is by far the most important thing you can do to identify ways to grow your business. If you understand the value of your customers you can:
• Determine which customers to invest in
• Identify new customers and markets to target
• Agree which product and service lines should be offered and promoted
• Change pricing to extract more value
• Identify the unprofitable customers you should “fire”
• Understand where to cut costs and investments that are not generating growth
STEP 1: Calculate the profit contribution of each customer in the current year
STEP 2: Develop a realistic estimate of how long you might retain each customer
STEP 3: Estimate the cost to acquire or retain the customer”
Value Per Visitor
The value of each visit is a simple metric to understand, but much harder to calculate. Basically, it asks how much each visit is worth. The simplest way to calculate this is by the number of visits divided by total value created.
Determining your fan/ follower growth rate is simple. Here’s how:
1. Take the number of followers you gained over the last month.
2. Divide that number by the number of followers you had at the beginning of the month. For instance, if you gained 90 followers this month and had 1500 followers at the start of the month, your follower growth rate this month was 90/1500 = 0.06, or 6%.n”
Virality Rate
“Virality Rate is the number of people who shared your post relative to the number of unique views (i.e., impressions) it had during a reporting period.
STEP 1: Measure a post’s impressions.
STEP 2: Measure a post’s shares.
STEP 3: Divide the number of shares by the number of impressions and multiply by 100 to get your virality rate percentage.”
Additional Social Media Metrics
Activity Metrics
These are the metrics that show what actions you are engaging in. It includes posting, scheduling and optimising content, answering questions and solving problems. Though it might seem trivial, these data will increasingly become more relevant as you decide to experiment on different aspects of the Digital Marketing campaign.
Average response time
The average time it takes a team member or brand representative to respond to comments and inquiries from the brand’s social media audience.
Content rate
“The number of pieces of content you produce per period. Depending on which types of content you focus on, you might want to content post rate apart, focusing on:
• Blog posts per period
• Presentations per period
• Videos per period
• E-books per period
• White papers per period
• Infographics per period
• Other types of content creation per period”
Post rate
Number of social media posts per period. Depending on which networks you’re active on, you might want to break post rate apart, focusing on:
• Tweets per period
• Facebook posts per period
• LinkedIn updates per period
• Google+ updates per period
• Pins per period
• Instagram posts per period
• Forum posts per period and any other social media networks you frequent
Post topic mix
The percentage of posts to each social media network per period broken down by content topic (e.g. resources, special offers, blog posts, etc.)
Post type mix
The percentage of posts to each social media network per period broken down by type (e.g., image, link, video, text, poll, etc.).
Social media marketing budget
The amount of money your team is spending per period
Reach Metrics
Metrics that measure on potential audience’s size and growth rate are crucial to marketers as this is an indication as to how well your marketing pitch is reaching out to your audiences. Let’s review some of these metrics here.
Audience growth rate
The rate at which a brand adds (or loses) audience members per channel, found by dividing new audience members by total audience members
Average position
The average position where a brand’s ad appeared on a search engine results page (with the top position on the page being 1)
Brand awareness
The overall number of mentions of your brand online per period
Influence score
Influence scores, offered by providers like Klout and Kred, measure how influential a person or brand is on a particular social channel
Keyword frequency
The number of times that a particular keyword or phrase is found within a brand’s social graph
Post reach
The estimated number of people who see a specific piece of your content at least once during a time period
Potential impressions
The number of times a piece of content could be displayed, regardless of whether it is interacted with, during a time period
Potential reach
The potential number of people in a brand’s audience, compounded by friends of audience members or others in a community who could have the opportunity to see a piece content, during a period of time
Sentiment
Percentage of overall brand mentions that are positive, neutral and/or negative in sentiment
Share of audience
The rough percentage of people a brand will reach as compared to its competitors
Share of engagement
How a brand’s engagement metrics compare to others in similar fields
Share of voice
How big a brand’s portion of the conversation is compared to others in their space
Video views
Number of views your video content gets on channels like YouTube, Vimeo or Facebook
Acquisition Metrics
This is the stage where your audiences are delving deeper into your site and see what it has to offer. This metric centres on matching up with what you are offering to the experience that your client is expecting.
Blog subscribers
Number of subscribers to your blog
Click-throughs
The number of clicks on a link within a post on a given social network
Email subscriptions
Number of subscribers to your email list
Links
Number of pages linking to a specific page of content on your site
Micro-conversions
Any measurable activity that a brand’s users frequently engage in before a conversion
Page views
Number of pages viewed or clicked on a site during the given time
Percentage of social visits
The percentage of traffic to your site that is referred by a social media source
Rank per keyword
Average position your content earns in a search engine for a specific key word or phrase
Traffic ratio
Percentage of traffic from each of three main segments, including:
• Direct visitors – Those who visit your site by directly typing your url in their browser address bar,
• Search visitors – Those who visit your site based on a search query
• Referral visitors –Those who find your site through another blog or site.
Retention Metrics
One of the components of a successful digital marketing campaign is to be able to track and measure retention metrics. Once you understand their usefulness, you can then start to use them to determine whether your digital marketing campaigns are successful or not.
Amount spent
Amount spent in your account currency
Avg. canvas view percentage
The average percentage of the Facebook Canvas that people saw. Canvas is a screen that opens on mobile after a person clicks the Canvas link in your ad. It may include a series of interactive or multimedia components, including video, images, product catalogs and more.
Avg. canvas view time
The average total time, in seconds, that people spent viewing a Facebook Canvas. Canvas is a screen that opens on mobile after a person clicks the Canvas link in your ad. It may include a series of interactive or multimedia components, including video, images, product catalogs and more.
Brand evangelists
Number of customers your brand would consider evangelists based on their social media advocacy
Customer annual or lifetime value
A prediction of the net profit attributed to the entire future relationship with a customer
Customer reviews/ratings
Number of positive or negative customer reviews or ratings received per period
Customer satisfaction
A measure of how products and services supplied by a company meet or surpass customer expectation
Customer satisfaction rate
A score expressed as a percentage between 0 and 100, with 100% representing complete customer satisfaction. This metric is most often determined by a single question in follow-up surveys along the lines of, “How would you rate your overall satisfaction with the service you received?”
Customer testimonials
Number of positive customer testimonials gathered per period
Support cost per ticket
The total monthly operating expense of a support team divided by the monthly ticket volume
Customer turnover rate/churn
A measure of the number of customers who leave over a specific period of time
K-factor
The growth rate of websites, apps, or a customer base.
Outbound clicks
The number of clicks on links that take people off Facebook-owned properties
Relevance score
A rating from 1 to 10 that estimates how well your target audience is responding to your ad. This score is shown after your ad receives more than 500 impressions.
Social clicks (all) (deprecated)
The number of clicks (all) when your ad was displayed with social information, which shows other Facebook friends who engaged with your Facebook Page or ad.
Social impressions
The number of times your ads were viewed when displayed with social information, which shows Facebook friends who engaged with your Facebook Page or ad.
Social reach
The number of people who saw your ad when displayed with social information, which shows other Facebook friends who engaged with your Facebook Page or ad.
Support cost per ticket
The total monthly operating expense of a support team divided by the monthly ticket volume
ThruPlay actions
The number of times your video was played to completion, or for at least 15 seconds.
Unique outbound clicks
The number of people who performed an outbound click
Unique social clicks (all) (deprecated)
The number of people who performed a click (all) on your ad when it was displayed with social information, which shows other Facebook friends who engaged with your Facebook Page or ad.
In Summary
The above information serves as a very good glossary of social media metrics and will definitely benefit you on your next social media project that involves analytics. These metrics will give you a good overview of your social media performance. With time and new goals, you will have more new and nuanced metrics to make them more relevant to your business.
At Equinet Academy, we have a Certified Digital Marketing Strategist (CDMS) programme that give you a more comprehensive overview of Digital Marketing. It consists of 6 core Digital Marketing modules that include :
- Digital Marketing Strategy
- Content Marketing Strategy
- Search Engine Optimisation
- Digital Advertising
- Social Media Marketing
- Digital Marketing Analytics with Google Analytics
The completion of these modules will lead the learners to attain a Certified Digital Marketing Strategist Certificate. We also offer an array of digital marketing courses taught in-person in Singapore or online.
Walter Lim
Walter is the Founder and Chief Content Strategist of Cooler Insights, with over 25 years of leadership experience in content & social media marketing, PR, strategy, and industry development. He is also the lead trainer for the Social Media courses here at Equinet Academy.
Never Miss a Post
Receive the latest blog articles right into your inbox.
Walter Lim
Walter is the Founder and Chief Content Strategist of Cooler Insights, with over 25 years of leadership experience in content & social media marketing, PR, strategy, and industry development. He is also the lead trainer for the Social Media courses here at Equinet Academy.
Reader Interactions